Our unit on the seasons has drawn to a close. Earlier I posted about how our understanding of what caused the seasons was consistent with the explanation offered by many other learners, including some Harvard University graduates. In that earlier post, I explored the model for seasonal changes first articulated by the children (that the seasons are caused by the distance the Earth is from the Sun) and how we tried to disrupt that model by presenting contrary evidence. For instance, we built a scale model of the Earth and Sun system and noticed that the orbit was almost perfectly a circle, and we graphed monthly average temperatures from locations in the Southern and Northern Hemispheres.
These activities convinced the students that the naive model we had created could not explain seasonal variation in temperatures.
However, we did not have adequate information to form an alternate explanation. And if, as I suggested in that earlier post, our minds create stories to explain what we do not know, then without an alternate explanation we were vulnerable to re-adopting our previous story as the passage of time caused us to forget the reasons we gave it up in the first place.
So, what we did next was to build an alternate story that the Earth’s tilt on its axis causes the seasonal differences in temperatures. This story is easy enough to say, but I worried that such a simple explanation did not allow the children enough time or data to build an alternate model.
I knew changing the story would be difficult because I ran a little experiment. I told the children that the reasons for the seasons was the Earth’s tilt, and then I asked them to tell me how the tilt might cause the seasons. Even with various props (tennis balls and golf balls, for instance), they had a difficult time articulating why the tilt should matter. In fact, because it was difficult to articulate, many reverted to a variation on the “closer to the Sun” story, arguing that the tilt brought one hemisphere “closer to the Sun” than the other, which made it warmer than the one “farther from the Sun.” Hmm…Asking the children to explain their thinking helped me see the persistence of the old model!
Somehow I needed to help them see that there were other reasons besides distance to explain the seasons. I developed some simple lessons and demonstrations designed to help us see that there is a “triple-whammy” that causes the hemisphere tilted toward the Sun to have warmer temperatures.
Increased Area in the Summer
First off, I showed them a video that helped them visualize the way the tilt made one hemisphere absorb more of the Sun’s energy.
We watched the video several times so we could see how during the months a hemisphere was titled toward the Sun it was exposing more of it’s area to the Sun, thereby causing it to absorb more energy over a given period of time. We drew sketches that showed the hemisphere that tilted toward the Sun had a larger area that got sunlight during those months.
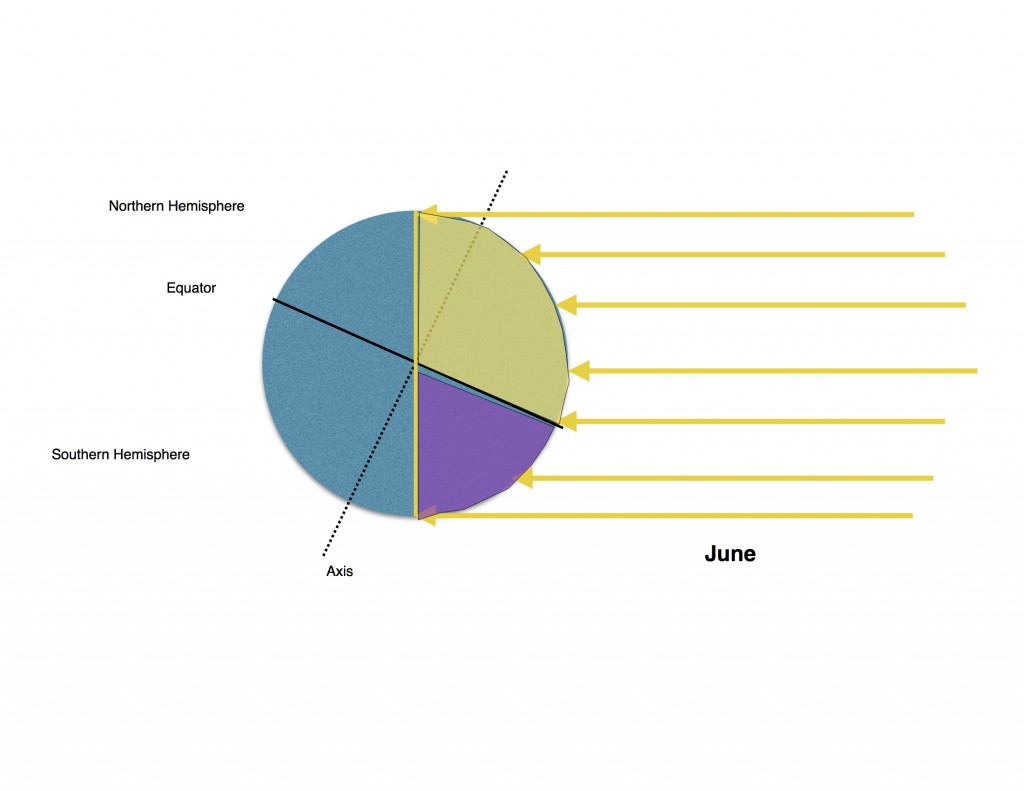
N. hemisphere summer. Note the increased area that absorbs the sun’s energy.
Finally, we thought of analogies to help us cement this in our minds.1
Here is one analogy that we used to help us: A room with a small window will let in less warm sunlight than a room with a large window. The room with the large window will be warmer than the one with the small window because there is a greater area exposed to the sunlight.
Increased Day Length in Summer
I found a website that helped me graph day length in Canberra, Australia and Dubuque, IA (the two cities that we were using as our reference points.) We examined the graph to see if we could describe how the length of day changed in each location over the course of the year. Then we compared the two locations. We noticed that the shape of the graph was very similar to the shape of the average temperature graphs that we had completed earlier.

Comparison of day length for Canberra, Australia and Dubuque, IA.

Comparison of average monthly temperatures. Canberra is in blue, Dubuque is in red.
Again, we tried to create an analogy that might help us better understand what we were seeing: The longer you leave something in the oven, the warmer it will be (until it is the same temperature as the oven!)
The children were starting to form an alternate story now. More area that gets baked, plus longer in the oven creates higher temperatures in the summer.
We still had one more reason to consider.
Higher Sun Angle in the Summer
While the two reasons we had explored were probably sufficient to cement an alternate story, I wanted the children to get a sense of energy per unit of area. Exploring this concept would provide another opportunity for the children to understand more deeply the idea of area, a crucial math concept that they had been exposed to in fourth grade.
First, I showed the students the angle of the sun in Canberra and Dubuque. We practiced estimating angles of the sun by pointing with our arms extended to the place in the sky the sun would be at different times of the year. 2 The children intuitively knew that the sun was lower in the sky in the winter than the summer, but the graph helped them see that the time of highest sun angle was different for Canberra and Dubuque.
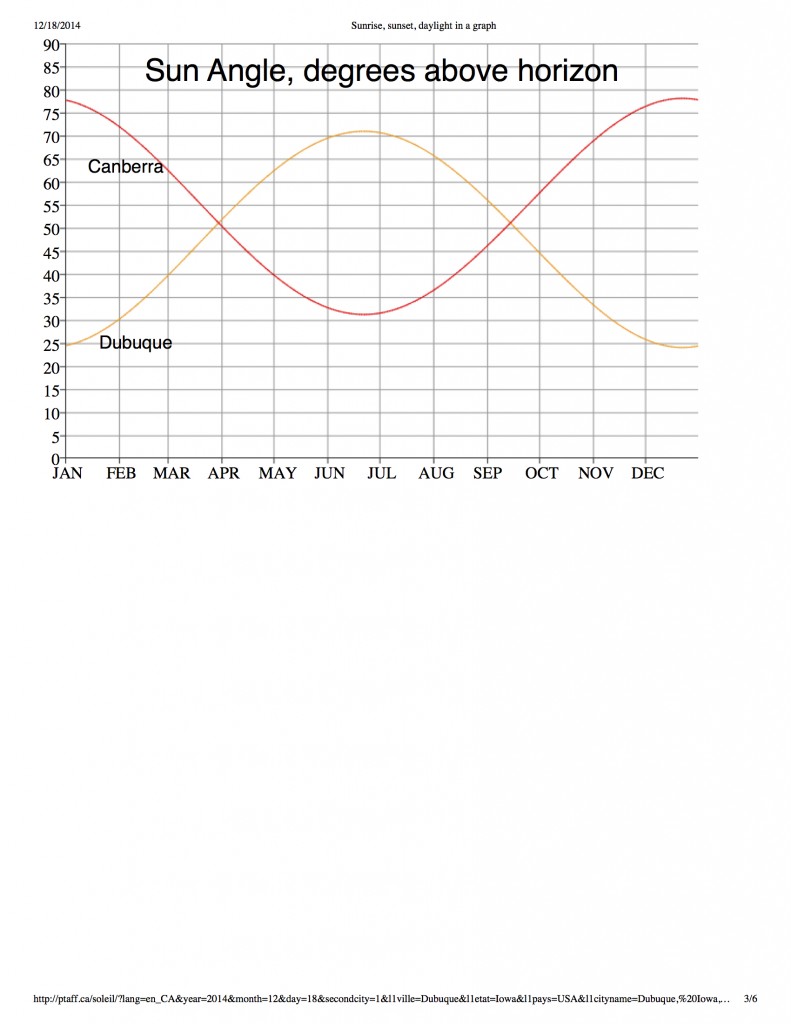
Comparison of the angle of the Sun by month for Canberra and Dubuque.
Earlier that day I set up two heat lamps. Both heat lamps were set 80 cm from a penny, and contained the same wattage of heat lamp bulb. However, one heat lamp was at a high angle to the penny (the summer position of the sun) and the other was at a low angle to the penny (the winter position of the sun.) I turned on the lamps and let the penny absorb the heat for 1.5 – 3 hours, depending on the time of the three science classes I teach. We measured the surface temperature using a digital laser thermometer.
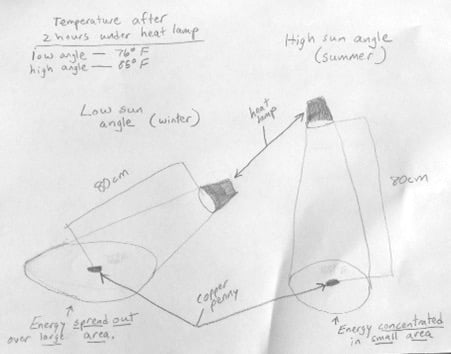
A sketch of the lamp set up.
As we examined the heat lamp set-up, the children estimated the area lit by the heat lamp bulb. They could easily see that the same amount of energy was spread over a large area when the “sun” was at a low angle and was more concentrated in a smaller area when the “sun” was at a high angle.
We searched for a suitable analogy and came up with this: When the sun is high in the sky, it’s like the Earth is baking in an oven set up to deliver more intense heat. The heat reaching the Earth is more concentrated during the summer months so each location on that hemisphere absorbs more heat than in the winter.
So, finally we had an alternate explanation. The Earth’s tilt creates a triple whammy that increases the temperatures in the hemisphere that is tilting toward the Sun:
- The tilt increases the area that can absorb the Sun’s energy in the hemisphere tilted toward the Sun, and decreases the area in the one tilted away from the Sun. This causes more of the Sun’s energy to be absorbed in one hemisphere than the other.
- The tilt also increases the day length in the hemisphere experiencing summer temperatures. The longer the day, the longer the Sun can bake that hemisphere, the more energy that hemisphere absorbs.
- Finally, the tilt increases the sun angle in that same hemisphere. The higher the sun’s angle, the more concentrated the energy is, which is like putting that location in a hotter oven.
So, not only is the hemisphere experiencing a hotter oven (sun angle) for longer periods of time (day length) there is more of it in that hotter oven at a time (area).
Was it worth it to spend this amount of time on what causes the seasons? Couldn’t we just learn a song to remember the causes?
I think it was worth the time.
If science is not just about learning a set of facts, but reasoning our way through arguments and creating explanations based on evidence, then I think the time we spent thinking through our evolving understanding was probably worth it. Perhaps one of the reasons we maintain our misconceptions even after we know the “facts” is because we create “stories” to explain the world to our satisfaction. That’s what I saw when I asked the children to explain the seasons even after they had left the “distance from the Sun” explanation in the dust. If we do not pause long enough to take in new information, to play with it, to bat it around, to consider the implications of that information, then we run the risk of not seeing the significance of that information and how it conflicts with the stories we create.
- One thing good science writers understand very well is how powerful a good comparison — most likely an analogy — can be for helping a learner understand an abstract concept. We humans are creatures of comparison! I tell the kids that comparison is one of our super powers. ↩
- This was good practice estimating angles from reference angles. The students had to identify 90 degrees, then half of that for a 45 degree angle. Using these two reference points, we estimated other angles in each location. ↩


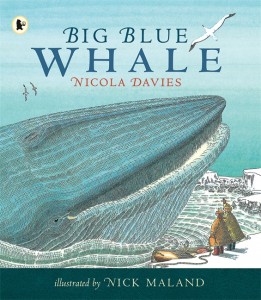 We began by studying several of Seymour Simon’s descriptions. You can pick just about any of his books since they are filled with great description. We ended our study with Nicola Davies’ short description of the outside of a blue whale from her book,
 The children each took a piece to study. They measured against the tiles on the floor; each stem was between 5 and 8 feet tall! They marveled at the size. They marveled at how different turf grass is from prairie grass. And how similar, too.


")