Science and the Scientific Method

“The most beautiful experience we can have is the mysterious — the fundamental emotion which stands at the cradle of true art and true science.”
— Physicist Albert Einstein

I’m moving this year to fifth grade. My assignment(s) will be one group of kids for reading and writing and three groups for science.

With the change in grade level, I have been exploring the Next Generation Science Standards (there’s a good free app through Mastery Connect) and also how people are thinking about teaching science these days. I discovered a website (Understanding Science) developed at the University of California, Berkeley. Among other things, I loved their flowchart of how science works.

The UC-B authors push back against the idea of a linear scientific method like those represented by the poster below. You can find these posters everywhere on line.

Traditional view of scientific method.

Traditional view of scientific method.

They offer this non-linear flowchart instead.

Science flowchart from UC-Berkeley Dept of Paleontology.

Science flowchart from UC-Berkeley Dept of Paleontology.

The UC-B authors liken the scientific method to the path the pinball takes through a pinball machine. Each node on the flowchart is a bumper. Sometimes the scientist bounces back and forth between Exploration and Discovery and Testing Ideas. Sometimes she bounces right on over to Community Analysis and Feedback before doing any testing, or even before developing a concrete question.

There are several things to like about this flowchart. For instance, I like the big space collaboration takes up. Science isn’t a lonely, singular activity. While Gregor Mendel might have done his genetics experiments on his own, most scientists do their thing with a bunch of other really geeky people.

I also liked the prolonged stage of exploration and discovery in this model. Too often, I think, we don’t give enough time for just living with a problem or an observation. I wrote about how fruitful it was to live with ambiguity in reading class for an uncomfortably long time. This is true in literacy as well as science. Maybe that slowing down is part of what learning is about?

I was intrigued by the many ways scientists “enter” the flowchart, through the door of their own curiosity, through surprising observations, practical problem-solving, and, really, by pure chance. Turns out that just being there with eyes and heart wide open is really important for science. Probably also for life.

To close: my eyes have been open around the home place. In my part of the world the sulfur shell mushrooms are appearing near the base of the oak trees. I know to look because I’ve been paying attention for years. July is when I start seeing them come. The other night I made a delicious snow pea/mushroom pasta in cream sauce with fresh garlic. The mushrooms came from just up the hill. There are many advantages to keeping my eyes open.

fungi-mushroom |Description=Laetiporus sulphureus-chicken of the woods |Source=Own work |Date=2006-08-13 |Author= Lee collins }}

fungi-mushroom |Description=Laetiporus sulphureus-chicken of the woods |Source=Own work |Date=2006-08-13 |Author= Lee collins }}

Rich Tasks — Saving Space for Student Thinking

Lots of time has passed since I last posted. I have been up to my eyeballs in new curriculum planning/envisioning (fourth grade is new for me), union negotiations (I’m the chief negotiator for our local), and in creating portfolio entries for my attempt to achieve National Board Certification. While there are many stories to tell about what has happened lately, a recent post about by mentor, ether-friend Vicki Vinton jarred loose a post that has been rattling around in my brain for awhile.

Vinton talks about how she’s benefited from her connection with math colleagues who talk about “rich tasks.” In upcoming posts, she will talk about how to apply the idea of rich tasks to reading, too. According to Vinton, rich tasks are those that “provide multiple entry points”, “invite creative and critical thinking”, “spotlight…both processes and product…(to help) students better see the connection between means and ends”, and “promote student ownership.” In other words, they are the kind of tasks that a teacher loves to create and witness.

Like Vicki, I’ve also benefited from being in touch with math thinkers who seek to understand what students are thinking, what their misconceptions are, where the limits of their knowledge and skill lie, and how they approach/attack a math task. 1 The richer the task, it seems, the greater the opportunity to discover the edges of student thinking. And, truthfully, teaching gets really fun when we are near those edges.

If there is any subject that can create a rich task, science is one! And that’s where we are right now.

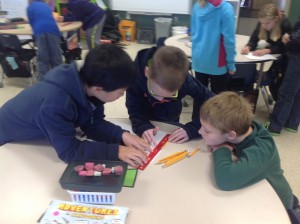
Recently we finished taking the IA Assessments 2 To celebrate, we’re learning a lot of science. 3 Our task has been to design and build an air-powered skimmer. 4

First, the students formed design teams. I asked them to create a logo and a slogan. That was an interesting task in itself. We “closely read” some logos and slogans that we found on line, how they tried to transmit those meanings through graphics and short text.

This part of the task helped me see many things, in particular how students tried to manage their own uniqueness as part of a group, but also their awareness of an audience outside themselves. Some were better able to imagine that outside audience than others. These degrees and kinds other-awareness were interesting grist for the teacher thought-mill, and seemed so connected to the crucial skills of listening and questioning that go into learning. A rich task like this helped me see the learners better. Anything that helps me understand them better as people seems to help my teaching.

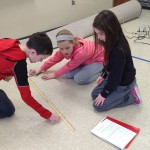
Then, the students were given the “task” to create a wind powered skimmer that would go at least 60cm, but as far as possible. They set to work creating their initial sail designs. I observed and asked questions about the rationale for their design work. What do you think will happen? Why did you put that there? Why did you make this shape? Questions of that sort.

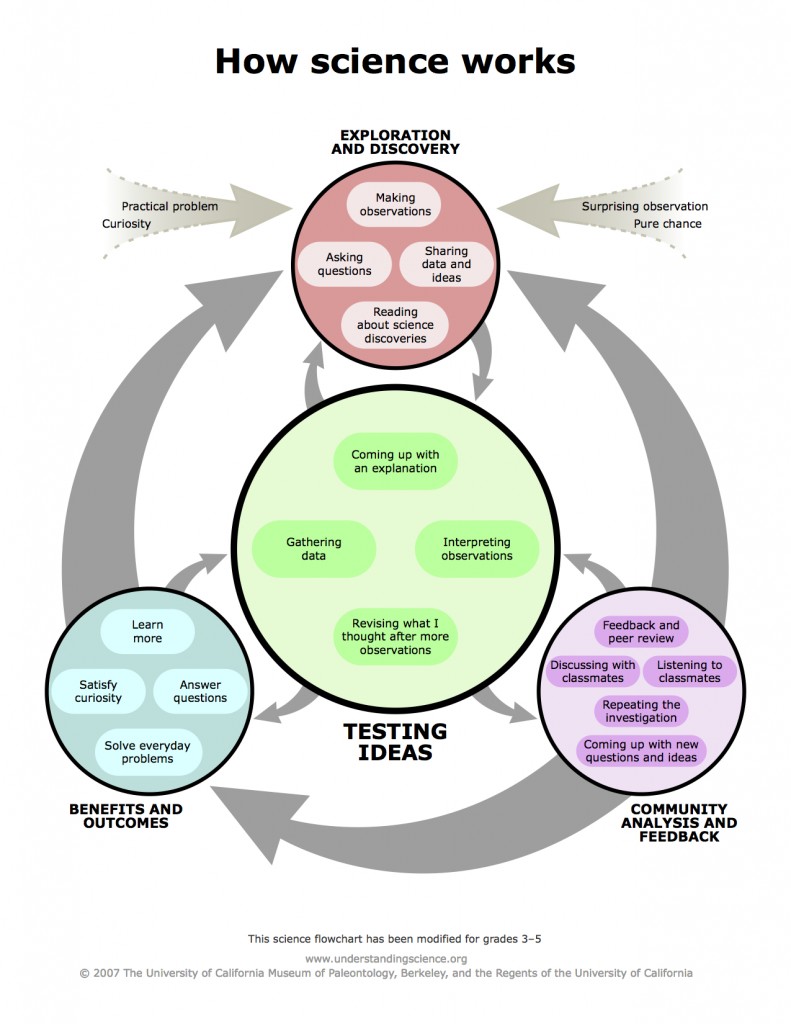
The project used a typical engineering design protocol, which we have used over and over again.


The design process we used.

The design process we used.

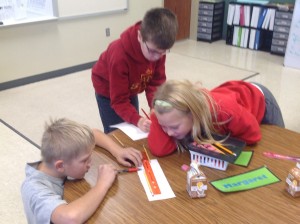
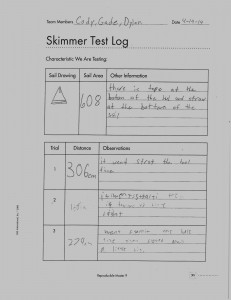
After the students designed their sails, they tested them, recorded the information from the tests, and re-designed to solve the problems that they discovered in the testing stage. I continued asking questions, helped them solve some of the group process issues that inevitably arose, and pushed them to examine the principles behind their designs. Although the students often “designed” based on principles (they had a gut-level sense of cause and effect as far as their design went), articulating those principles in more general ways is new to them and one of my goals for this project.

Scan_clee_314041604350_0003

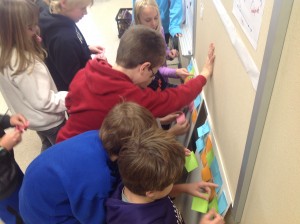
Along the way, to help them focus on what we could generalize from our work, we gathered together periodically to talk about what design principles we have discovered about what make sails work well, which the children could use to help them re-designed their sails. I introduced them to vocabulary like these: friction, friction force, sail frontal area, hull, bow, stern, mast, torque…

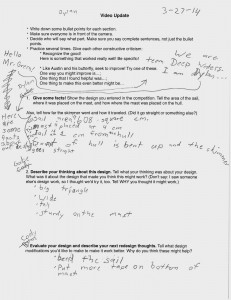
Finally, we had a competition to see whose sail design would make the skimmer go the farthest. Each design team then evaluated the results of the competition. We created short videos (ostensibly to “send” to the EarthToy company president, IM Green) describing the design as accurately as possible, the outcome of that design as evidenced by the competition, their thoughts on why this outcome happened (using scientific terminology), and what their next design idea would be and why they expect that idea to be an improvement over the one they entered in the contest.

This reflection was an interesting task in itself, and putting it in video form allowed the children a chance to reflect on their presentation for future work.

Scan_clee_314041604350_0001

I realized from this process that I am so much happier, as a teacher, working backwards from student thinking to strategy instruction than I am starting with delivering the strategy without deeply knowing the student thinking first. I really enjoy giving the students a big, unwieldy problem or task whether it be in math, in science, or in reading. Then I like to probe the children’s thinking as they complete the task. This kind of teaching is less efficient and messier, I know. 5

This kind of rich science task could be transferred to other areas by analogy. For example, just this last week, as we were revising drafts of persuasive essays, one of the students mentioned that revising was a lot like what we were doing in science with our skimmers. I asked for elaboration (love that word). His response: It’s where we design something and then change it to make it perform better. If we can internalize that idea, that revision is re-design for the purpose of better performance, then perhaps it will make our writing better, too? Maybe, too, it’s at the heart of growth mindsets and those wonderful “principles” of math practice that the CCSS-Math outlines.

  1. I have learned a lot from the work of Dan Meyer, especially his 3-Act Math, Christopher Danielson, and Joe Schwartz.
  2. This is the test formerly known as ITBS, which I’ve heard some of the wittier middle school students re-name as a statement without a linking verb: it bs.
  3. Teachers understand how testing crowds out the best stuff. The best stuff is often messy and takes time. During testing, time is of the essence and messiness doesn’t fit the schedule.
  4. I wrote and received a grant to purchase a couple A World in Motion kits last year from the Governor’s STEM Start-up funding stream. We are using, and modifying, these materials.
  5. Interestingly, several of the math thinkers I follow are aware of how their focus on rich tasks, uncovering student thinking, and multiple solutions has spawned a counter-movement, one that focuses on explicit instruction of the most efficient algorithms, and “efficient” transmission of new knowledge. In Canada, for instance. Obviously, I’m much more aligned with the “new math” crowd than the efficient transmission camp. Like my math mentors, I feel that good teacher questioning should be designed to help me, and the children, understand the principles behind our thinking, principles we use to build our next level of understanding. I am pessimistic, though, that without strong conceptual understandings even the most efficient of algorithms are all that efficient in the long run.

Our Pencils are Moose: A Look at Classroom “Environment”

Moose Saying
Creative Commons License Photo Credit: Doug Brown via Compfight

Last week we pretended our pencils were moose and our classroom a habitat. In the process, we learned some math and science.

You see, we’ve had problems with these cheap-o pencils from WalMart, the ones the kids buy at the Back to School sale at the beginning of the year. Those pencils break and are really difficult to sharpen. The experience of using them can be so frustrating that last week Trysten came to me and wondered whether the cheap pencils were really cheaper than the more expensive, but more durable pencils.

Seizing the moment, we decided to see if we could answer Trysten’s question.

Enlisting the help of my partner’s expertise in biology–Beth is a plant ecologist–we conducted a “mark and recapture”-type experiment. I’m reporting some of the preliminary results and, more importantly, thinking about some of the interesting possibilities that this simple question posed for how I can teach math and science, with possible links to social studies.

The Experimental Design

We imagined our classroom to be a habitat and we imagined that the two kinds of pencils — the more expensive MegaBrands and the cheaper Dixons — were two different populations of animals. We cleared our classroom environment of all other pencils. We “released” 30 new, marked pencils of each brand back into the environment. We took an oath to be good scientists and use the pencils as we normally would, to not favor one pencil over the other because we wanted our experiment to not be biased by our choices. The pencils we released would “roam” around our classroom habitat doing whatever good moose-pencils normally do: draw, write, doodle, and wait patiently to be sharpened.

Recapture!

After a week in the “wild” we “recaptured” our moose-pencils to see if any of them “died” over the week. We also measured the remaining pencils to the nearest 1/10 of a cm to see how “sick or healthy” they were. Would there be a difference in the two groups of pencils?

Measuring to 1/10 of a cm helped us become more solid with both fractions and decimals. The kids were really engaged in that kind of measuring and they not only got a sense of how scientists collect measurement data, but why they need to measure to a high degree of accuracy.

We had to think about how to create a data table and how to record accurate information. Note the delegation of tasks and the use of a white sheet of paper to make measurement more accurate!

We had to think about how to create a data table and how to record accurate information. Note the delegation of tasks and the use of a white sheet of paper to make measurement more accurate!

Students measure pencils carefully to see how "healthy" they are after a week roaming the wilds of our classroom.

Students measure pencils carefully to see how “healthy” they are after a week roaming the wilds of our classroom.

Data Analysis

After measuring, we noticed that the cheaper Dixon pencils seemed shorter as a group. I asked the children how we could compare the two brands to see for sure if one lasted longer than the other. We talked a lot about how to do this; could we compare the biggest only? Each pencil from smallest to largest? The smallest only?

I told them that scientists often have to compare groups with each other just as we are having to do, and suggested that we needed to not just compare individual pencils, but we would need to somehow compare an entire group of pencils with another entire group. How could we do that?

One student, Isaac, mentioned that maybe we could compare the average size of the pencils in each group (or the median). That way we would be comparing all the pencils of one brand (by calculating the mean or median) with all the other pencils of the other brand.

This was a central insight about elementary-level statistics, and considers a question that scientists have to think about all the time! Also, while we have been figuring medians and means for awhile, the children have never actually understood why these values are important. To me, this insight about why scientists need to think about means and medians was one of the best things to come from our experiment.

Here are two pictures of the children figuring out the median pencil size by re-arranging sticky notes with the pencil sizes on them. To do this, we had to think about how to represent the “dead” pencils, and decided that their “health” should be 0.0 cm. They also had to think about simple things like how to construct data tables, and how to incorporate new data into their evolving medians as new research groups added more sticky notes to their growing collection.

Note all the hands actively involved in rearranging the sticky notes. There was a lot of great conversation. Students in the back were beginning to notice patterns between the two data sets.

Note all the hands actively involved in rearranging the sticky notes. There were a lot of great conversations. Students in the back were beginning to notice patterns between the two data sets.

Even re-arranging the sticky notes required the children to think through an organized way to do this evolving task as new data was coming as research groups completed their measuring.

Even re-arranging the sticky notes required the children to think through an organized way to do this evolving task as new data was coming as research groups completed their measuring.

Our results showed average pencil size of 13.3 cm for the MegaBrands (1 “death”) and 10.2 cm for the Dixons (four “deaths.)

Next Steps

Next, we will graph our data. We still haven’t decided how to figure out whether the cheaper pencils are actually cheaper. As one child asked: What if the cheap pencils were only a penny, but broke very easily, and the others were $1,000 but lasted a long time. Maybe it would still be cheaper to buy the cheap pencils.

Perhaps we will have to figure out how to use our “mark and recapture” data to predict when all of pencils will “die.” We will also need to gather information about price differences between the two pencils. Then we’ll probably need to compare our “death rates” with the difference in price. This will be difficult for the kids to imagine as they haven’t had experience with graphs as “predictors” of outcomes before, but I think the fact that they have now “lived” the experience of using the pencils, and have seen the differences in lengths that resulted from those days in the wild, that when we graph the data they will see how graphs render those differences visually. Perhaps then the children may be ready to draw a line on a graph down to zero and understand how a graph might help us understand a future event.

Finally, if the kids are interested, I’d love to turn this experiment into a look at how pencils are made and at the way consumer goods (and consumer choices) are influenced by price, which is influenced by the sourcing of the pencil wood and lead material, and probably also the labor costs. Where do the leads and woods for the cheaper Dixon pencils come from? This could be a fascinating way to look at global trade, the sourcing of raw materials, and the effect of labor cost on the manufacture of consumer goods.


Learning Math, Math and Learning

Deep Down Inside, We All Love Math T-Shirt Design
Creative Commons License Photo Credit: _Untitled-1 via Compfight

For some time I’ve been thinking about how to get more real-world math in our classroom. Our school district uses the Everyday Math program and I’ve been sometimes surprised at how little “everyday” there is to go along with the “math.”

We have participated in Franki Sibberson’s Solve It Your Way challenge, which the kids have really enjoyed. This month asked the question: Who in your family jumps the highest? We decided to use this as a whole class activity AND also as a way to practice some data collection and analysis skills we are learning in math class.

We moved through a scientific processes assuming Franki’s question as our own. We created a hypothesis, and thought a bit about how we would conduct the experiment so we could develop a list of materials to gather.  That’s where the thinking got interesting. We generated a list of materials — yardstick, jumpers, flat space, data table — but we had a difficult time thinking about how we could collect accurate data since a jump happens so quickly.

I had an idea that we might be able to use a video camera to slow the jump speed down, but I didn’t want to come right out and tell the kids that; I wanted them to grapple with the dilemma for awhile.

We talked about several ways we could collect data, including having someone lie on the floor and try to figure out how far up the yardstick children could jump. (That seemed hard to do since jumps happened so quickly.) We thought about extending our arms up a wall, measuring that extension, then jumping with something to put a mark against the wall. We’d subtract the jump mark from the non-jump mark. (I thought that was a pretty elegant solution to the problem since it wouldn’t rely on fast looking but on using mathematical differences. We could accurately measure the distances, too!) The problem with that solution, though, was we didn’t think we’d do our best jumping while trying also to make marks on a wall, so this method wouldn’t be an accurate measurement of our jumping abilities.

Next, I mentioned that we had some technology we could add to the mix, for instance we could add digital photography since I had both kinds of cameras in the room, and would that make a difference in how we designed the experiment?

The kids grappled with the implications of this new information. (“Maybe we could try to take a picture of the highest point of the jump?” But from their experience taking digital still photos, others said that wouldn’t be an easy thing to do.) Finally, one boy thought we might be able to try slow motion video. Others agreed. And that’s how we got our idea to create a video of our jumping.

When we looked back on the video we made, it was too hard to see the inch marks on the ruler so we re-jumped with inch marks clearly marked on a roll of tape paper. (An example of how scientists sometimes learn from our “failures.”) That change helped quite a bit! We were able to play the slow motion video until each jumper was at the top of the jump, stop the motion, and suspend the jumper in mid-air. (By the way, this was hilarious, seeing us all suspended in the air like that!)

What I learned from this — and what some of the children learned as well — was how closely connected the need for accurate data collection is to the design of the experiment. If flexible thinking is one goal of our learning together, then this was a good example of how we could achieve that outcome. We had to think how our materials and our need to slow down the act of jumping, which influenced how we did our experiment.

And this backward/forward type thinking reminded me of the work that we are trying to do in literacy as well, to be aware of the whole, rather than just the parts. There is no single, straight path to a solution, rather we hack our way through the jungle.

So, finally, here’s a short (3:22) video of our attempt to answer the question.

Ball Rolling Experimental Design

Franki Sibberson (who along with virtual colleague,  Mary Lee Hahn, write the superb A Year of Reading) has started a new website (Solve it Your Way!) devoted to helping children learn by tossing around questions that beg to be answered through experiments. I was intrigued by this idea and am using some of the early time of our school year, before things really get rolling for good, to explore and play with this idea, and to encourage the children to take on the challenge. Also, projects like this help reinforce the idea that ours is a classroom that thinks.

The first question Franki asked was this one: Which type of ball rolls the farthest?

A couple days ago, I introduced them to the question, and we began to think about how to answer it. I’ve copied a post from our classroom blog below. I’m excited about the possibilities

(Reblogged from my new classroom website.)

Here are the results from yesterday’s discussion of the un-homework assignment #1: What type of ball rolls the farthest? It was a fascinating discussion!

The first response was…”huh???? I don’t get it!” Which was pretty much what I expected. But, as you can see from the notes that I took, the children started asking questions; I simply recorded what they said. Soon, we began to explore the question with a surprisingly scientific outlook. Here’s a summary of our thinking. This thinking may help you devise an experiment to answer the question.

What to roll? Size, shape (footballs, for instance???), how many? What will matter? Will heavy ones roll farther? Light ones? Bouncy ones?

Where to roll? What kind of surface matters? Slippery? Hard? Soft? Will different balls roll farther on different surfaces? (We decided that the surface needed to be the same one for each ball, so it was fair.)

Fairness. Our rolls need to be fair. Using Annika’s wonderful word, We need to launch the balls in a fair way, so one isn’t launched with more force than another. One method Isaac brought up was they could be rolled down the same ramp. Others talked about how they could throw a ball the same; Kadin and others thought that the same person could throw the ball and try to be fair. We decided that the surface needs to be the same for each ball, though.

Measuring and recording. How will we measure the distance? How will we keep track of the distance (create a table? write down the distances?) Will we record only forward distance, or sideways distance, too?

Trials. How many times should we roll each ball? (We worried that one roll might not be accurate enough…) We thought at least 3 times each, but maybe more to make sure?

So, there’s some of our thinking. I’m impressed with the way the children were able to think through experimental design — thinking about isolating variables (though we didn’t talk that way, I’ll introduce those terms later), thinking about how to measure and record results, thinking about what makes a fair try, and thinking about doing several trials to make sure that what we find out is really true and not just a random chance event.

To get to this level of thinking is why we’re doing these projects in the first place!

Remember, if your child does decide to do this experiment, talk it through, plan it out, and try to record some of the experiment on video or photo. That will make for a nice presentation at the end.

via Ball rolling experimental design | 4-Peterson.

In Search of Explanations: A “Close Reading” in Science Class

With the Common Core Standards (CCS), educators are thinking a lot about “close readings.” Close readings often are second or third readings designed to deeply understand ideas and meanings, while analyzing how those meanings are conveyed. Close reading is A LOT of work; they require A LOT of motivation. How’s a teacher supposed to DO THAT? And with third graders?

In a recent post, “Finding time for close readings,” Burkins and Yaris urged teachers to see close readings as a thinking activity that we routinely do, not just something we plan to teach at a single moment.

To us, close reading is reader action which involves the synthesis of a host of comprehension strategies, hence it is relevant in any teaching context. Because close reading is performed by the reader, it can be practiced within the context of all teaching structures. When we read aloud, we can reread and ask students to cite evidence and elaborate their thinking in ways that lead to new ideas about text. When students work with texts during guided reading, we can ask questions or lead discussions that require that students return to the story to carefully reread in ways that help them notice details that they didn’t see the first time around.

I think I can share an example of this kind of thinking about close readings.

Our science unit of study has been water and its properties. Last week, I wanted the students to get a sense of the concept of diffusion as a way for them to understand the concept of molecules. Molecules are difficult for third graders to really understand, and since diffusion is difficult to imagine without understanding molecules, I thought it might be good to combine a simple demonstration with a close reading to help them understand how molecules help liquids “mix themselves.”

To do this, I stole a demonstration idea from Walter Wick’s book, A Drop of Water. Rather than have the students read the book and look at the pictures in it, I simply reversed the order of events. To start, we dropped food coloring into a cup of clear water and took some time lapse pictures with our IPEVO webcam. Here are the images we got.


A few days later we clicked through the images forward and backwards several times (a close reading of images!), observed the changes, and tried to describe what happened. The kids came up with ideas like these:

  • At first the green kind of burst like fireworks.
  • The green spread out all over the cup.
  • The green seemed to drop down from the dark green spot on top and up from the dark green spot on the bottom.
  • The green looked almost like ribbons sometimes.

I introduced them to two word sets — concentrated/concentration and diffuse/diffusion — to help them explain what happened. “Spread out” became diffused. “Dark green” became concentrated. I was really pleased with how well this worked. Having the vocabulary emerge from their need to describe helped us understand why scientists need a specialized vocabulary: it helps them be more accurate and precise!

Then we asked questions that seemed to demand explanations. Here are some samples.

  • How did the green diffuse through the whole glass so evenly?
  • Why did some concentrated green stay on top?
  • Why did the green look like fireworks when it first dropped?
  • Why did some concentrated green sink to the bottom?

Finally, I told them we were going to read a piece of informational text that might help us answer some of our questions. This is what scientists do when they observe something that is puzzling; they go try to find out if anyone else has thought about those questions, too.

We read this short piece from Walter Wick’s book out loud, pencils and highlighters in hand to find the parts that might help us answer our questions.

From, Walter Wick, (1997). A Drop of Water.


I saw some puzzled eyes when we reached the word “molecules” (I had explained what molecules were in a couple of previous lessons, but our knowledge was not yet complete or sophisticated.) Then several children let out a collective “OHHH!” when we reached the third paragraph. Highlighters came out and pencils scratched. When we reached the end, I asked the children if they thought they knew the answer to any of their questions now. Of course, they could see that this helped them answer their question: “How did the green diffuse through the whole glass so evenly.”

I asked the children if they could turn their papers over and explain the answer to another student. That was fun to watch. They struggled and struggled with forming an adequate explanation. Many wanted to turn their papers back over because they forgot many of the details. Talking revealed to them the holes they had in their explanations.

Finally, I told them that they had experienced something a lot of readers experience, myself included; that is, when they find the answer to a question, they often experience an “Ah-ha!” and a sense of satisfaction. But, sometimes a reader has to reach another level, when you have to actually use what you know, and this requires careful reading and thinking. I told them we were going to re-read the part that would help us develop a more complete idea of diffusion so they could explain it to others. I mentioned that this is something that I do all the time when I’m trying to figure out how to explain something to them, or when I want to really learn something well.

We re-read the last paragraph very slowly, pausing at each sentence, sometimes even at each phrase, in order to check to see if we could explain what was happening. To help visualize what was happening on the molecular level, we acted out being molecules. We imagined how we would act if we added heat, took away heat, if we added green food coloring what would happen to that food coloring. It took us about 20 minutes to read and process the text, including reading the entire piece once and the third paragraph one additional time very slowly.

Based on their second explanation attempt, the children came away with a better understanding of how molecules act in a liquid, how diffusion happens, and why diffusion wouldn’t happen very quickly in a solid. In the process, they speculated on how evaporation occurs (“Maybe the molecules bang against each other so hard that some get knocked out of the liquid?”) and even got a rudimentary understanding of electrostatic bonding in molecules (“Water molecules act sort of like magnets. Sometimes they attract each other and sometimes they push each other away.”)

Are we all solid with these concepts? Nope. And I’m sure their understanding will “decay” quickly if we don’t talk about molecules again soon. But this close reading of images and text gave us a solid foundation from which to build.

Not bad for a days’ work. And Burkins and Yaris are right, “close readings” can happen anywhere and with anything.