Thinking Long and Hard, in which We Create a New Model for Seasonal Change

Our unit on the seasons has drawn to a close. Earlier I posted about how our understanding of what caused the seasons was consistent with the explanation offered by many other learners, including some Harvard University graduates. In that earlier post, I explored the model for seasonal changes first articulated by the children (that the seasons are caused by the distance the Earth is from the Sun) and how we tried to disrupt that model by presenting contrary evidence. For instance, we built a scale model of the Earth and Sun system and noticed that the orbit was almost perfectly a circle, and we graphed monthly average temperatures from locations in the Southern and Northern Hemispheres.

These activities convinced the students that the naive model we had created could not explain seasonal variation in temperatures.

However, we did not have adequate information to form an alternate explanation. And if, as I suggested in that earlier post, our minds create stories to explain what we do not know, then without an alternate explanation we were vulnerable to re-adopting our previous story as the passage of time caused us to forget the reasons we gave it up in the first place.

So, what we did next was to build an alternate story that the Earth’s tilt on its axis causes the seasonal differences in temperatures. This story is easy enough to say, but I worried that such a simple explanation did not allow the children enough time or data to build an alternate model.

I knew changing the story would be difficult because I ran a little experiment. I told the children that the reasons for the seasons was the Earth’s tilt, and then I asked them to tell me how the tilt might cause the seasons. Even with various props (tennis balls and golf balls, for instance), they had a difficult time articulating why the tilt should matter. In fact, because it was difficult to articulate, many reverted to a variation on the “closer to the Sun” story, arguing that the tilt brought one hemisphere “closer to the Sun” than the other, which made it warmer than the one “farther from the Sun.” Hmm…Asking the children to explain their thinking helped me see the persistence of the old model!

Somehow I needed to help them see that there were other reasons besides distance to explain the seasons. I developed some simple lessons and demonstrations designed to help us see that there is a “triple-whammy” that causes the hemisphere tilted toward the Sun to have warmer temperatures.

Increased Area in the Summer

First off, I showed them a video that helped them visualize the way the tilt made one hemisphere absorb more of the Sun’s energy.

We watched the video several times so we could see how during the months a hemisphere was titled toward the Sun it was exposing more of it’s area to the Sun, thereby causing it to absorb more energy over a given period of time. We drew sketches that showed the hemisphere that tilted toward the Sun had a larger area that got sunlight during those months.
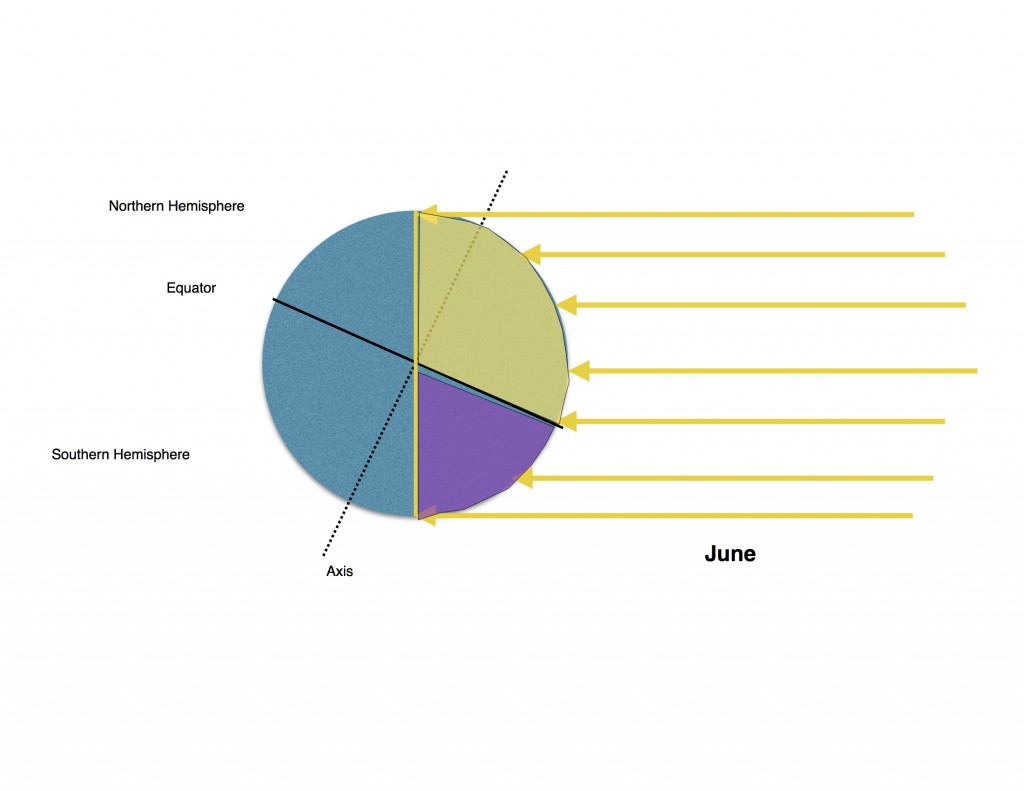
N. hemisphere summer. Note the increased area that absorbs the sun's energy.

N. hemisphere summer. Note the increased area that absorbs the sun’s energy.

Finally, we thought of analogies to help us cement this in our minds.1

Here is one analogy that we used to help us: A room with a small window will let in less warm sunlight than a room with a large window. The room with the large window will be warmer than the one with the small window because there is a greater area exposed to the sunlight.

Increased Day Length in Summer

I found a website that helped me graph day length in Canberra, Australia and Dubuque, IA (the two cities that we were using as our reference points.) We examined the graph to see if we could describe how the length of day changed in each location over the course of the year. Then we compared the two locations. We noticed that the shape of the graph was very similar to the shape of the average temperature graphs that we had completed earlier.

Comparison of day length for Canberra, Australia and Dubuque, IA.

Comparison of day length for Canberra, Australia and Dubuque, IA.

Comparison of average monthly temperatures. Canberra is in blue, Dubuque is in red.

Comparison of average monthly temperatures. Canberra is in blue, Dubuque is in red.

Again, we tried to create an analogy that might help us better understand what we were seeing: The longer you leave something in the oven, the warmer it will be (until it is the same temperature as the oven!)

The children were starting to form an alternate story now. More area that gets baked, plus longer in the oven creates higher temperatures in the summer.

We still had one more reason to consider.

Higher Sun Angle in the Summer

While the two reasons we had explored were probably sufficient to cement an alternate story, I wanted the children to get a sense of energy per unit of area. Exploring this concept would provide another opportunity for the children to understand more deeply the idea of area, a crucial math concept that they had been exposed to in fourth grade.

First, I showed the students the angle of the sun in Canberra and Dubuque. We practiced estimating angles of the sun by pointing with our arms extended to the place in the sky the sun would be at different times of the year. 2 The children intuitively knew that the sun was lower in the sky in the winter than the summer, but the graph helped them see that the time of highest sun angle was different for Canberra and Dubuque.
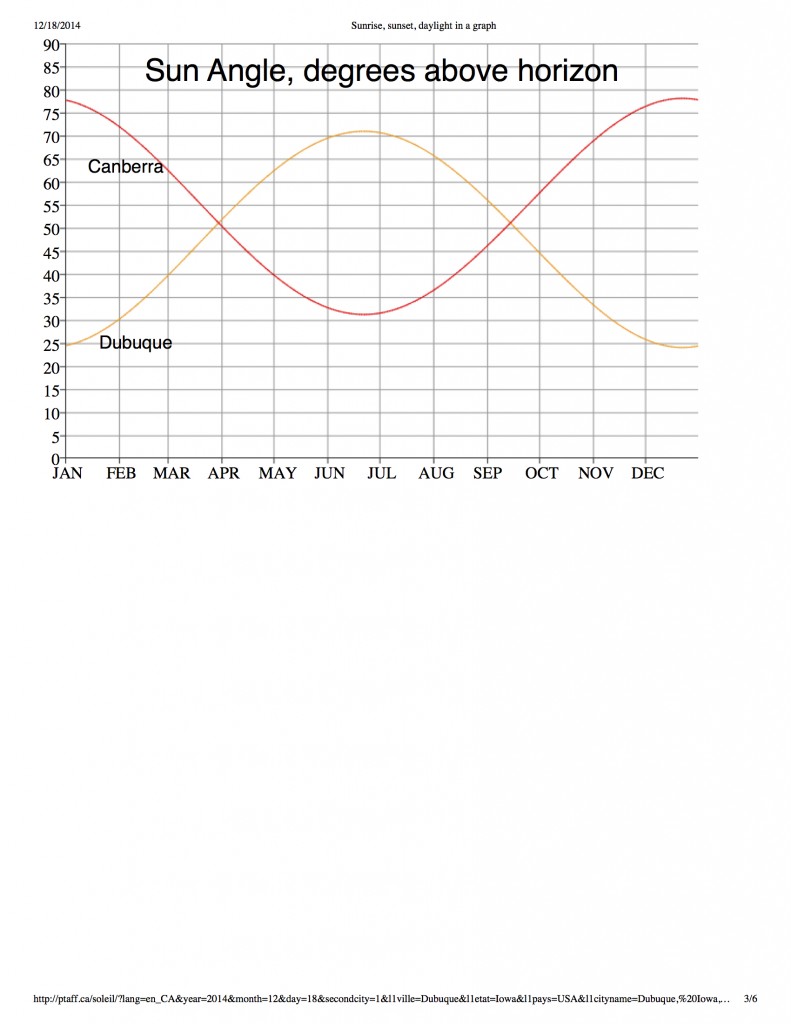
Comparison of the angle of the Sun by month for Canberra and Dubuque.

Comparison of the angle of the Sun by month for Canberra and Dubuque.

Earlier that day I set up two heat lamps. Both heat lamps were set 80 cm from a penny, and contained the same wattage of heat lamp bulb. However, one heat lamp was at a high angle to the penny (the summer position of the sun) and the other was at a low angle to the penny (the winter position of the sun.) I turned on the lamps and let the penny absorb the heat for 1.5 – 3 hours, depending on the time of the three science classes I teach. We measured the surface temperature using a digital laser thermometer.
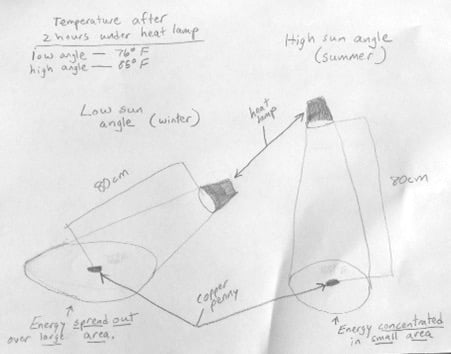
A sketch of the lamp set up.

A sketch of the lamp set up.

As we examined the heat lamp set-up, the children estimated the area lit by the heat lamp bulb. They could easily see that the same amount of energy was spread over a large area when the “sun” was at a low angle and was more concentrated in a smaller area when the “sun” was at a high angle.

We searched for a suitable analogy and came up with this: When the sun is high in the sky, it’s like the Earth is baking in an oven set up to deliver more intense heat. The heat reaching the Earth is more concentrated during the summer months so each location on that hemisphere absorbs more heat than in the winter.

So, finally we had an alternate explanation. The Earth’s tilt creates a triple whammy that increases the temperatures in the hemisphere that is tilting toward the Sun:

  1. The tilt increases the area that can absorb the Sun’s energy in the hemisphere tilted toward the Sun, and decreases the area in the one tilted away from the Sun. This causes more of the Sun’s energy to be absorbed in one hemisphere than the other.
  2. The tilt also increases the day length in the hemisphere experiencing summer temperatures. The longer the day, the longer the Sun can bake that hemisphere, the more energy that hemisphere absorbs.
  3. Finally, the tilt increases the sun angle in that same hemisphere. The higher the sun’s angle, the more concentrated the energy is, which is like putting that location in a hotter oven.

So, not only is the hemisphere experiencing a hotter oven (sun angle) for longer periods of time (day length) there is more of it in that hotter oven at a time (area).

Was it worth it to spend this amount of time on what causes the seasons? Couldn’t we just learn a song to remember the causes? 

I think it was worth the time.

If science is not just about learning a set of facts, but reasoning our way through arguments and creating explanations based on evidence, then I think the time we spent thinking through our evolving understanding was probably worth it. Perhaps one of the reasons we maintain our misconceptions even after we know the “facts” is because we create “stories” to explain the world to our satisfaction. That’s what I saw when I asked the children to explain the seasons even after they had left the “distance from the Sun” explanation in the dust. If we do not pause long enough to take in new information, to play with it, to bat it around, to consider the implications of that information, then we run the risk of not seeing the significance of that information and how it conflicts with the stories we create.

  1. One thing good science writers understand very well is how powerful a good comparison — most likely an analogy — can be for helping a learner understand an abstract concept. We humans are creatures of comparison! I tell the kids that comparison is one of our super powers.
  2. This was good practice estimating angles from reference angles. The students had to identify 90 degrees, then half of that for a 45 degree angle. Using these two reference points, we estimated other angles in each location.

Questioning the Stories We Tell Ourselves — Misconceptions in Science Class


misconception definition

Science educators have long noted that learners can hold misconceptions about important scientific concepts. These misconceptions are often formed in elementary school, and can be surprisingly difficult to shake. 1

Lately I’ve been thinking a lot about how I might help students create stories to contain and connect the information they are learning in science class. I wondered if misconceptions might somehow be connected with the stories we tell ourselves. 2

As Daniel Kahneman, author of Thinking, Fast and Slow notes, our brains have a hard time NOT making sense of things. We create stories to help us connect things, to remember them, and to make sense of things. Sometimes we jump to conclusions because the “story” we tell ourselves makes intuitive sense, but might be built on flimsy evidence.

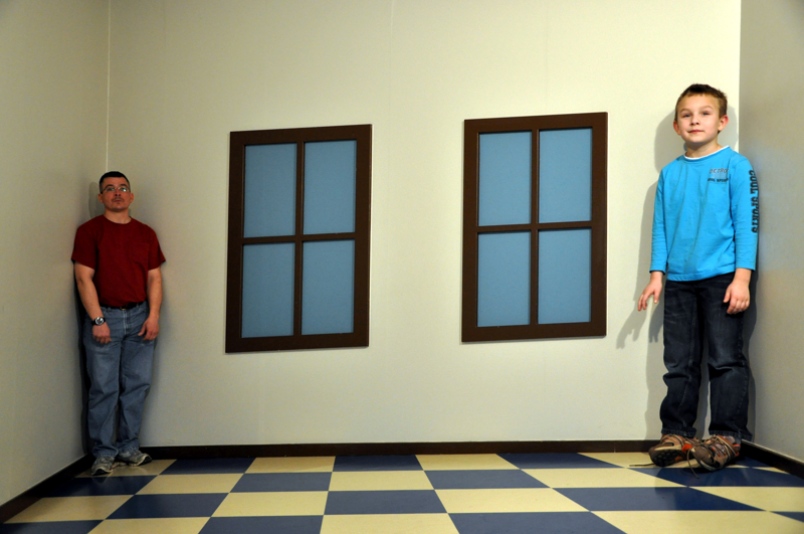
from http://www.stripes.com/sports/stuttgart-huge-indoor-playground-is-a-world-of-wonder-for-kids-1.130591

from http://www.stripes.com/sports/stuttgart-huge-indoor-playground-is-a-world-of-wonder-for-kids-1.130591

The fact that we can see a connection between things, even if it is superficial or tenuous, can serve as evidence that the connection is true and important. We sometimes don’t question the story we tell ourselves because it seems like the story confirms what we already knew. Contrary evidence is discarded or, perhaps, not even noticed because it does not fit with the story we have created.3

What if the stories we tell ourselves about why or how things happen is strongly influenced by this almost innate desire to create stories with some degree of coherence? What does that mean for how I address misconceptions in science class? Perhaps it is really important to interpret the stories we tell ourselves, to determine the underlying “theme” (theory or model) that holds the story together. Then we can test that unifying concept against alternate versions of the story to see what holds us to the evidence we see in the real world.

Such was my thinking when we entered our learning unit on what causes the seasons.

At the very beginning of our learning, I gave the students this task:

The weather in our area is much colder than it was at the beginning of the year. We started the year at the end of summer and now we are entering winter. What do you think causes summer and winter? Jot down some words to explain why this happens. Please make a sketch of the Earth, the Sun, and how they move in relationship to each other to help me understand your explanation.

That evening I looked at the stories that emerged and found some surprising commonalities. For instance, about 10% of the children drew diagrams that had the Sun revolve around the Earth. We needed to deal with that important minority opinion.4 A very large number of children described the Earth in an elliptical orbit around the Sun. In this model, the seasons are caused by the Earth being closer to the Sun in the summer, and farther away from the Sun in the winter.

This is our first model of the Earth and the Sun. It's purpose was to visually represent (model) our explanation for the seasons.

This is our first model of the Earth and the Sun. It’s purpose was to visually represent (model) our explanation for the seasons.

The next day I asked the children why they thought this was the case. The first thing most said was that they hadn’t thought of trying to figure out the causes of winter and summer before, so my request was a challenge for them. But then they offered an explanation that the elliptical orbit placed the Earth closer to the Sun during July (a hot month) and farther from the Sun in January (a cold month). They argued that it made sense to them because the closer you are to a heat source, the warmer you get; the farther you are from that source, the cooler you get. In other words, this explanation makes intuitive sense based on their lived experience. Even though they had not really thought about the Earth’s orbit much before, they worked backwards from that lived experience to fit the orbit with the experience. While it bothered some that the Sun wasn’t in the center (“It doesn’t look right.”) they were willing to let go of that to make the model fit with the notion of how distance and temperature are related.

In fact, this explanation was also the one provided to the interviewers who asked Harvard graduates the very same question back in the 1980s.

Given our model, we made some predictions:

  • The closer the Earth gets to the January position in the orbit, the colder the temperatures will be.
  • The closer the Earth gets to the July position in the orbit, the warmer the temperatures will be.

I gave the children average temperature data by month for two locations: Dubuque, IA (close to our school location) and from Canberra, Australia (about as far from us as we can get.) Their task was to graph these data and to check it against what our model predicted.

The children set out to graph temperature data from Canberra, Australia and Dubuque, IA.

The children set out to graph temperature data from Canberra, Australia and Dubuque, IA.

Within minutes I heard exclamations like these:

  • Wait! What’s happening?
  • This can’t be right!
  • What?
  • Canberra is almost opposite of Dubuque!
  • What could cause that…?
  • Wow. I didn’t expect that.

I also showed the children a video that I had asked my wonderful brother to make. (He happened to be in Australia this last month.) On the day he shot it, the temperature was 84 degrees on the beach in Australia and 11 degrees in our town.

Then I asked the children to gather into groups to talk about the implications of what they had learned. Their task was to discuss these questions:

  • Does the evidence support our model, or cause us to question our model?
  • If it causes us to question the model, then what changes to our model would you make?
  • What additional information do you request from me in order to revise this model?

After a few minutes in their groups to try to come up with a different model (using sundry balls we had in the classroom), we gathered together to talk. We discovered that almost everyone wanted to change the model. Most wanted to change it drastically. Now they felt that the Sun had to somehow be in the center. Since the Earth was both warm and cool at the same time, they felt that an elliptical orbit would no longer work as an explanation. However, they grappled with how to explain the seasons, then; how could they develop a model that would take into account the fact that winter and summer appeared at the same time, but in different places? The advantage of the previous model was that it had explained temperature differences between the seasons. The disadvantage of the model was that it didn’t fit the more complex reality of actual temperatures on the Earth. Now, we were left without an explanatory model. That’s an uncomfortable position to be in.

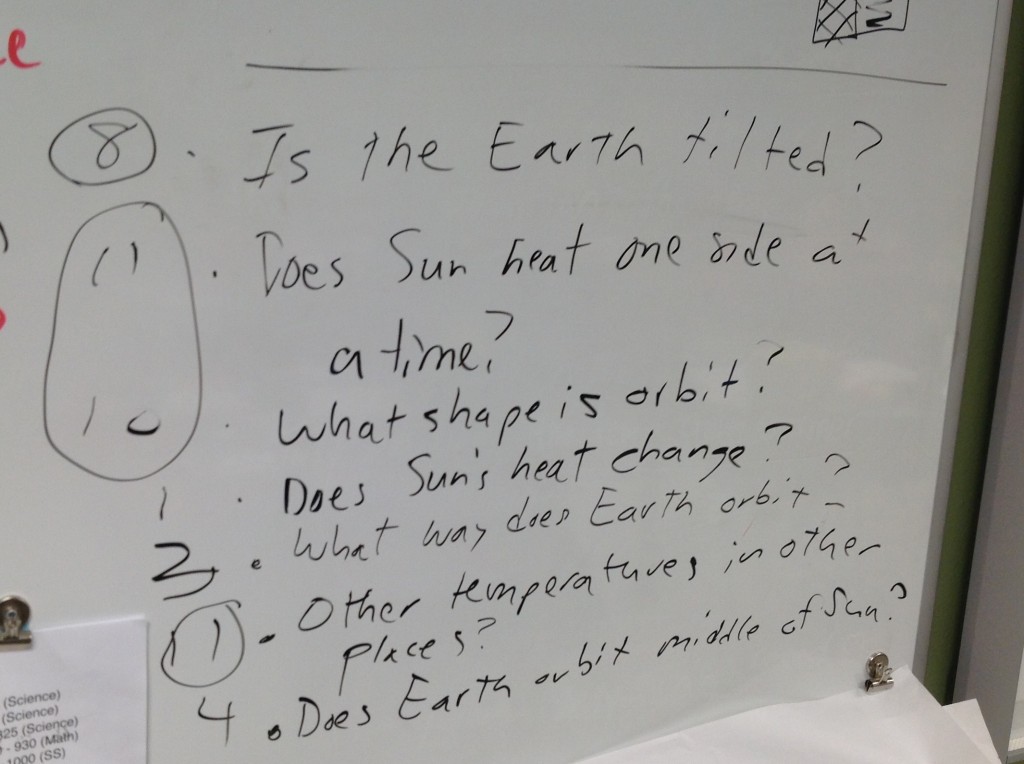
Acknowledging the work they had done to try to revise the model, I asked them what new information they wanted to make sure their next model was more accurate. Here is a list of some new questions/requests for information:

These are some requests for additional information from the students. The numbers to the left side are the number of votes each request garnered.

These are some requests for additional information from the students. The numbers to the left side are the number of votes each request garnered.

Toward the end of last week I gave them data about the orbit of the Earth around the Sun and the diameters of the Earth and the Sun in order to help them answer their question about the shape of the Earth’s orbit. Their task was to make a scale model of this system given the data that I presented to them. I’ll post about this fascinating discussion next week, if I get a chance.

This whole process has been intriguing and, well, scary — like walking a tightrope is scary: I don’t want to make a mis-step. For instance, I gave the children a lot of space in class to discuss the first “elliptical orbit” model, knowing that it was inaccurate. We even used class time to develop a rationale for why that might make sense. So, in a sense I was helping the children develop a misconception, maybe even solidifying that misconception in their own minds. I worried about that.5

But, I think it will work out okay in the long run. This has been a puzzle that they have to think about. They have had to be engaged, thinking through the entire activity: one child: “This is so hard! It’s confusing…but fun to try to figure out!” And now they are accumulating information that has caused them reject their first model. I’m noticing that they are not going back to it, even though they do not have anything to take its place. I suspect that reluctance to readopt it might stem from the fact that moving from it wasn’t imposed on them by an “authority figure” like me, but from their own reasoning through the implications of the model they created. I’m hoping that the next model we create will provide enough explanatory power that it will stick more strongly than the “closer means more heat, farther means less heat” model.

Our next steps will be to offer alternative explanations using data about day length and sun angle to help them see why the seasons happen when they do. I’ll report back on what I learn from this process.

  1. Check out the science-related website, Veritasium, for their Misconceptions playlist. It’s fun to watch. Here’s an example:

  2. My own inquiry explores the implications of the idea that our minds, as author Thomas Newkirk reminds us, are “made for stories.” I presented some of this early thinking with a panel of wonderful folks at the NCTE14 conference in Washington, D.C. in November. One recent project brought me to experiment with collaborative story creation as a way to more deeply learn science concepts. As I explored this process, I was impressed by how deeply the kids processed complex scientific ideas. It seems that being able to put ideas into words, to see and articulate the relationships between ideas, to tell the story of a particular idea really does matter.
  3. This is the definition of confirmation bias, the tendency to seek out and assign greater weight to evidence that confirms our preconceived notions. I suspect that this tendency ALSO might come from our ability to create stories. Coherence matters to those stories. But, maybe my attributing this tendency to our need to create stories is an example of confirmation bias, itself!
  4. We dealt with that by acting out the orbit of the Earth and the Sun as partnerships in various corners of the room. Then we compared our ideas and arrived at a community consensus that the Earth revolved around the Sun, not the other way around. This wasn’t “proof” in any scientific sense, but everyone had heard that this was the case, so could accept the idea once they had acted it out and they could see why it looks like the Sun is orbiting the Earth each day.
  5. One teaching associate who visited the classroom during one of those days later told me that she thought that she had the reasons for the season wrong after our discussion. That worried me!

Waiting for the Arrival, or, How Jumping to Conclusions May be Important to Understanding

The Arrival_cover

We began our exploration of immigration by beginning a “read aloud” of Shaun Tan’s wordless graphic novel, The Arrival. I told the kids that we were going to be studying the topic of immigration, which is the word social scientists give to the idea that people move from one place to another. That’s about all I told them, so far.

My goal has been to open up some ideas about immigration in a way that the kids could first feel the disorientation and reorientation of the immigrant, before we got into some more of the nitty-gritty aspects of the topic. I’m thinking, here, of how some experiences (war, famine, persecution, hope) pushed people to leave what they knew in the home country to begin a new life in a strange land, the different experiences that people endured along the way, the disorientation of the arrival, the power structure immigrants landed in, and, using whatever resources they possessed, the way immigrants tried to make a new home for themselves in their new land.

Ultimately, I want the kids to begin to understand how this powerful force in history shaped people and places. But I also hope the students might understand the immigrant’s story metaphorically, as the story of any journey into a new land. The immigrants’ disorientation and reorientation applies to many situations.

Maybe, as we read we might see our own lives, our own learning as a kind of immigration from once familiar territory into a new, barely understood land. At the very least, for rural Iowans whose immigrant identity is tenuous to vanishing, we might gain a better sense of our fellow citizens whose experience with home and belonging is so different than our own. Perhaps. Perhaps.

We gathered on the floor, in chairs, and around nearby tables while I projected the book from my iPad onto the screen.

We began to read and talk.

*   *   *   *   *   *   *

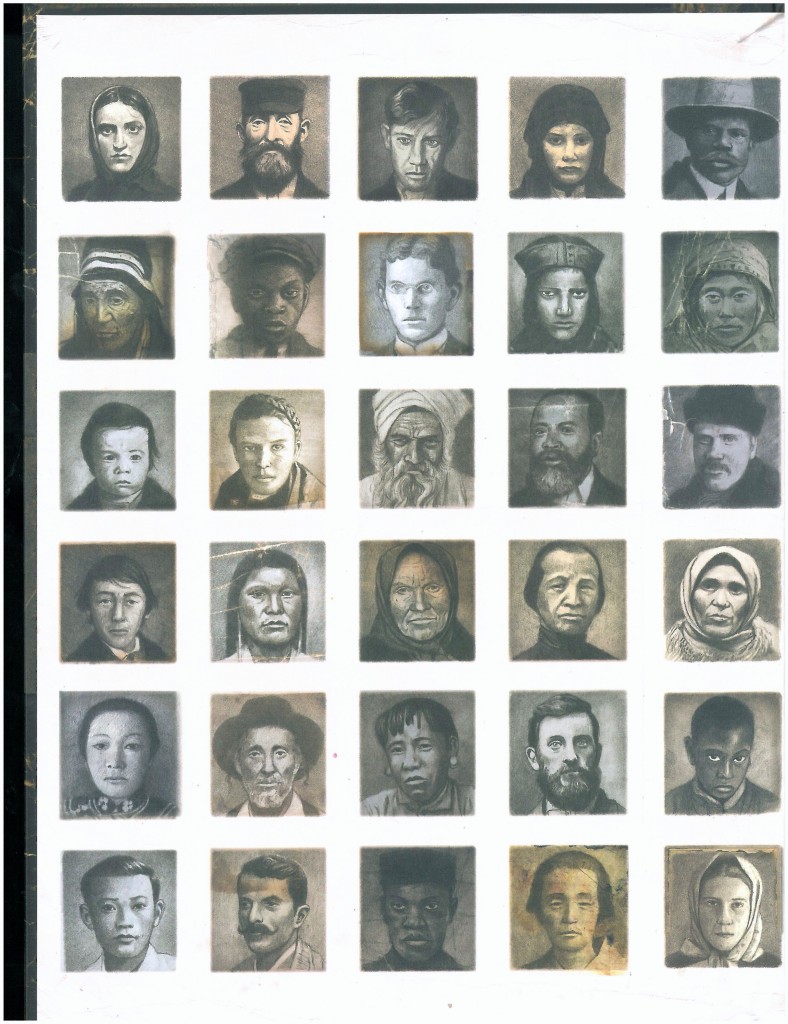
Almost immediately, I ran into several of those moments that Vicki Vinton talked about in a recent post where the students she read to jumped to conclusions that seemed problematic. After the cover page, Tan presented us with this magnificent two-page spread:

The Arrival_faces1 The Arrival_faces2

I asked the children what they made of these. They thought for a moment, and then several children began to form a conclusion.

Me: What do you think about these pages?

Student A: Hmmm. It looks like these are terrorists. (Others agree.)

Me: (Taken aback.) Terrorists? What makes you think that?

Student A: Well, I’ve seen people look like that on the TV when my mom watches her news.

Me: What is it about them that you recognize?

Student B: I agree with (Student A). They look like terrorists because some of them have those hats that they wear on their heads, the ones that twist up…

Me: (To myself: Oh no! This isn’t going where I expected…or want…or anywhere good.) Ok. We think these people might be terrorists. Why do you think the author wanted us to be thinking about terrorists right now in the book?

Student C: Maybe because something is going to happen that’s really bad and the author wanted to plant a clue for us right now?

Me: (To myself: Hmmm….that’s pretty good thinking about how authors use these early opportunities in books.) Ok. Maybe the author wants to warn us about something. Let’s read more to see if we can connect anything to these pictures and to other parts of the book.

(Before I can start to flip the pages again.)

Student D: Maybe they are slaves?

Me: (To myself: Hmm…this is going to be interesting!) Why do you think that?

Student D: They look like they aren’t very happy and some of them look like the pictures I’ve seen of slaves. Besides, there’s a picture of a little kid on the third row down on the left side and I don’t think this kid is a terrorist, but I know that some kids were slaves.

Me: Ok. So now we have two different ideas about what these pictures mean. 1) They are a warning that terrorists might attack. 2) They are pictures of slaves that…what?

Student D: …might be arriving somewhere. That way we can connect to the title, too.

*   *   *   *   *   *   *

We read on. The pictures tell the story of a man leaving his family. We notice they are poor, and the woman and man are very sad to be parting.

Arrival_parting

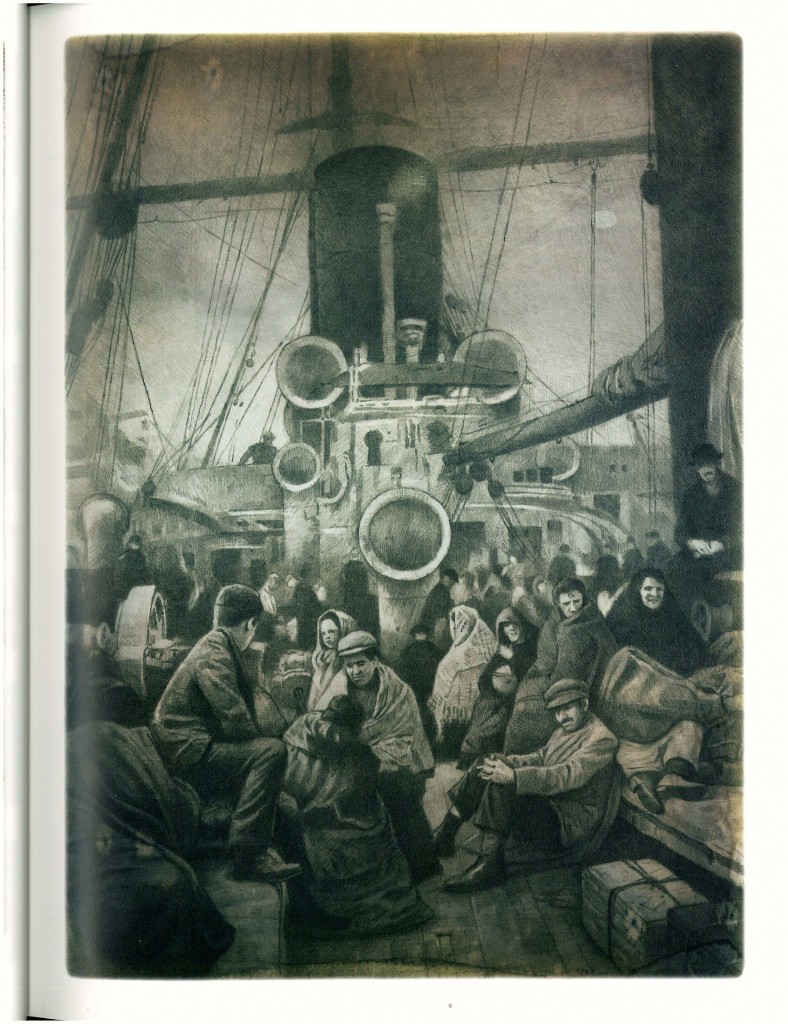
The man takes a train from the station and then boards a boat. After many days at sea — delightfully rendered by many small drawings of different kinds of clouds — we see this picture.

Arrival_boat

Suddenly, the ideas about who those people were at the beginning of the book changed!

Student A: I don’t think those were terrorists or slaves anymore. I think they are the people that got on this boat.

Me: Tell me more.

Student A: I think the author wanted us to think about all of these different people getting on a boat to go somewhere. They are sad because they have left their families, like the father was sad when he left his family.

Others: Yes! There are all of these people that had to leave their families and go on a train, maybe, and now a boat and soon they are going to arrive somewhere else.

Me: (To myself: I’m glad that I just let the early stuff go so we could come to this.) So, we discovered something here, didn’t we? We started out thinking th0se people were terrorists, then slaves, and now we think they might be other people, lots of different people who look very different from each other — all of whom are leaving their own homes for somewhere else. You’ve connected this set of images to other things you’ve noticed in the story and you’ve changed your mind as you got more information. That’s really cool, kids, that you can stick with something like that until it starts to make sense, and until you can connect it to lots of other details in the story. Congratulations.

Let’s see where this new idea takes us, okay?

*   *   *   *   *   *   *

It may be that the struggle the children engaged in as they jumped to conclusions helped them to first notice the differences between the immigrants in the two-page spread of faces (the strange faces, the long beards and mustaches, the wrapped heads.) This is a crucial understanding that I hoped they would get, that all immigrants are not alike, and that not all immigrants would even feel comfortable around the other, though they share the same “name”: immigrant.

Perhaps it was necessary for them to live with the idea of difference, even if it brought them to a place that was pretty uncomfortable for me for awhile. (Watch out for the terrorists!) Only after living with that for awhile were they able to understand that while the difference between the people on that page was significant for the story, the terrorist idea didn’t fit and they could eventually discard it.

Similarly, their conclusion jumping — they are slaves! — emerged from noticing the expression on the faces and putting that together with the differences in the faces. This idea of unhappiness or worry, too, might have been necessary for them to notice and to live with for awhile so they can feel deeply the emotions those who leave must feel.

As we read further in the story, the difference between the people, as well as the worry and sadness they had on their faces, might help us better understand what it must be like to be so different, one from the other, and so alone in a new world.

Uncovering Misconceptions in Math: More on Decimals

In a recent post I talked about how difficult decimals are to learn. I asked the kids to explore the place value and fraction qualities of decimals by dividing a meter into 1/10, 1/100, and 1/1,000.

Well, I checked back to see how well those ideas were understood. I’m glad that I did because those conversations revealed an interesting way that a small number (5 of 21 in my class) had “encoded” the learning that we did that day.

Here’s the problem that I gave the kids: Pablo ran 9/10 of a mile in gym class. Walter ran 0.92 miles. Who ran farther. Explain your reasoning.

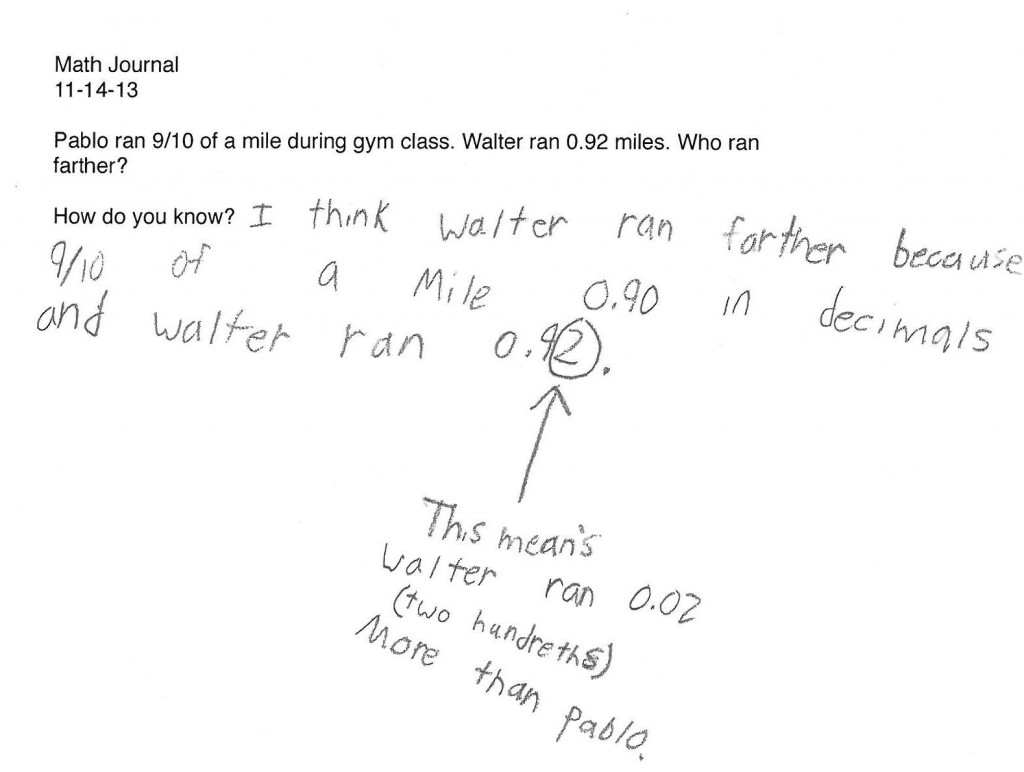
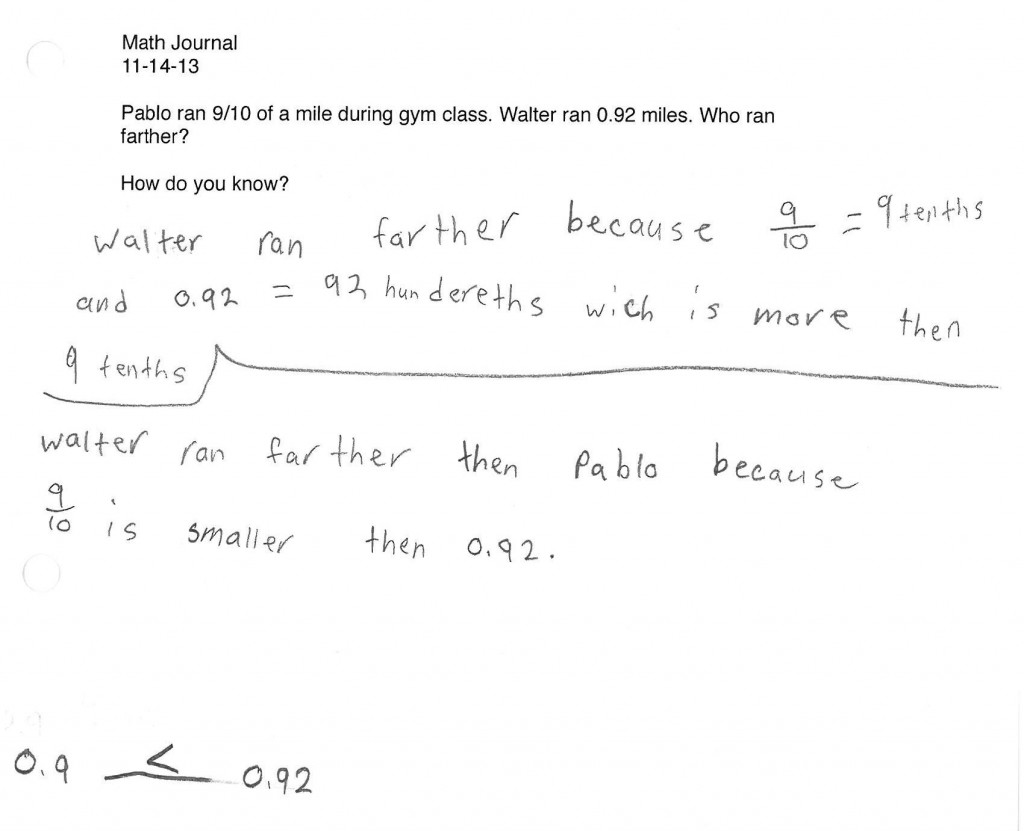
Most of the children identified Walter’s distance as longer, explaining that they were close, but that Walter ran 2/100 (0.02) of a mile farther. This showed some good grasp of the notion of place value in decimals. Here are a couple examples of that line of thinking.

A clear explanation of the difference between the two distances.

A clear explanation of the difference between the two distances.

Another fairly clear explanation of the difference in distances.

Another fairly clear explanation of the difference in distances. This one doesn’t identify the difference as clearly as the above example, but still shows good understanding of decimal place value.

However, several students appeared to have internalized the concept that the farther to the right from the decimal a numeral is, the smaller the piece was. So, for example, they had been impressed by the “smallness” of the 1/100 compared to the 1/10, the smallness of the 1/1,000 compared to all the other parts of a meter we looked at.

But, the students hadn’t deeply understood the idea of what that means in terms of place value, so they had formed a fuzzy understanding that any number that has numerals farther to the right must be smaller because the pieces are smaller.

In addition to this fuzzy thinking about relative piece size, their explanations contained a general sense that decimals were surprising, so the “normal rules” did not apply  to the right of the decimal point. In fact, by listening to their explanations, decimals were almost mirror images of “normal numbers,” a term this group used often in conversation. In this world, numbers that appear large (like 1/1,000) actually represent very small pieces. It is only one small step to assume that all numbers that appear larger are actually smaller.

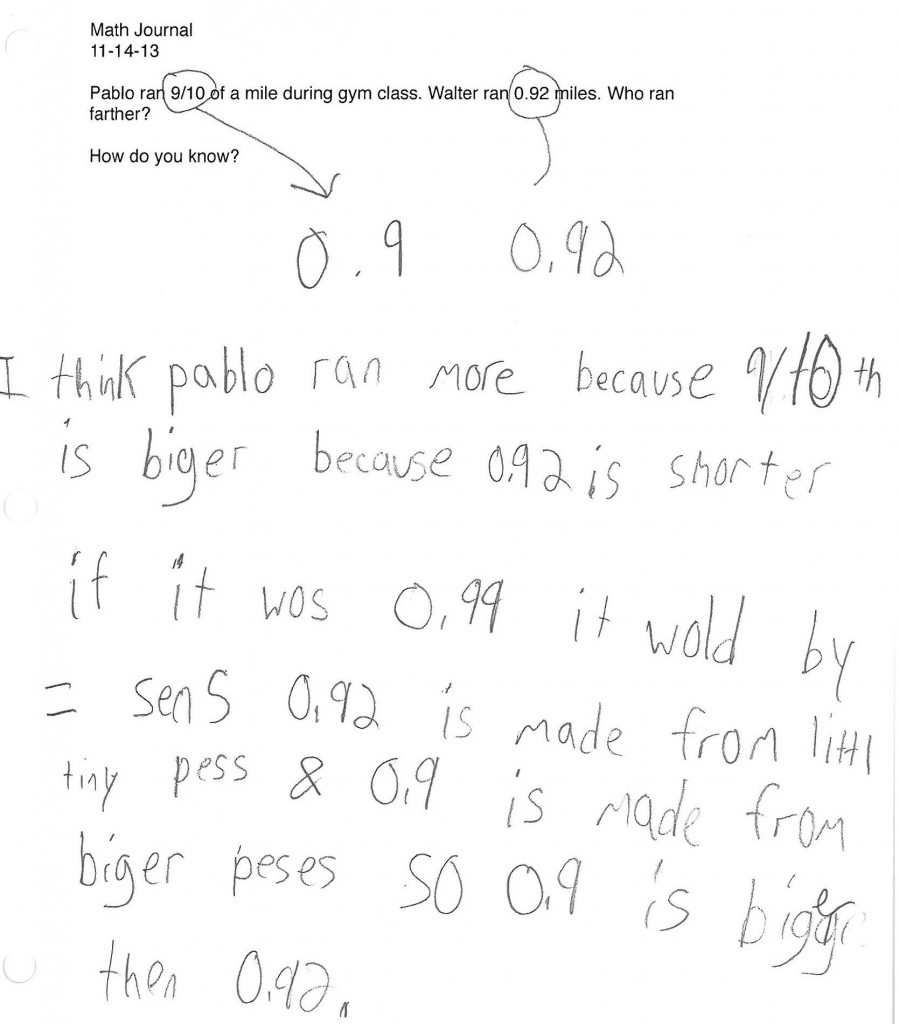
Here are some examples of that kind of thinking. Notice they overlook the central idea of place value and substitute the misconception that decimals don’t follow the normal rules, so large numbers are actually smaller than small numbers.

Notice the discussion of the size of pieces, without incorporating place value concepts.

Notice the discussion of the size of pieces, without incorporating place value concepts.

Again, this explanation highlighted the idea of piece size, rather than place value concepts.

Again, this explanation highlighted the idea of piece size, rather than place value concepts.

All of this shows that while getting answers right or wrong is important in math, understanding the origins of student misconceptions and the function they serve for the learner’s developing understanding is crucial for the teacher’s next steps.

What we did on Thursday and Friday was explore the concept of place value, drawing and modeling what 92/100 vs. 9/10 (90/100) looked like, while still maintaining the notion that 1/100 of anything results in smaller pieces than 1/10.