![]() Photo Credit: Doug Brown via Compfight
Photo Credit: Doug Brown via Compfight
Last week we pretended our pencils were moose and our classroom a habitat. In the process, we learned some math and science.
You see, we’ve had problems with these cheap-o pencils from WalMart, the ones the kids buy at the Back to School sale at the beginning of the year. Those pencils break and are really difficult to sharpen. The experience of using them can be so frustrating that last week Trysten came to me and wondered whether the cheap pencils were really cheaper than the more expensive, but more durable pencils.
Seizing the moment, we decided to see if we could answer Trysten’s question.
Enlisting the help of my partner’s expertise in biology–Beth is a plant ecologist–we conducted a “mark and recapture”-type experiment. I’m reporting some of the preliminary results and, more importantly, thinking about some of the interesting possibilities that this simple question posed for how I can teach math and science, with possible links to social studies.
The Experimental Design
We imagined our classroom to be a habitat and we imagined that the two kinds of pencils — the more expensive MegaBrands and the cheaper Dixons — were two different populations of animals. We cleared our classroom environment of all other pencils. We “released” 30 new, marked pencils of each brand back into the environment. We took an oath to be good scientists and use the pencils as we normally would, to not favor one pencil over the other because we wanted our experiment to not be biased by our choices. The pencils we released would “roam” around our classroom habitat doing whatever good moose-pencils normally do: draw, write, doodle, and wait patiently to be sharpened.
Recapture!
After a week in the “wild” we “recaptured” our moose-pencils to see if any of them “died” over the week. We also measured the remaining pencils to the nearest 1/10 of a cm to see how “sick or healthy” they were. Would there be a difference in the two groups of pencils?
Measuring to 1/10 of a cm helped us become more solid with both fractions and decimals. The kids were really engaged in that kind of measuring and they not only got a sense of how scientists collect measurement data, but why they need to measure to a high degree of accuracy.
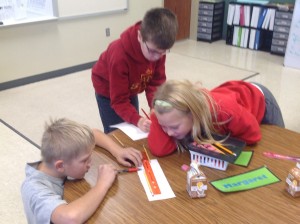
We had to think about how to create a data table and how to record accurate information. Note the delegation of tasks and the use of a white sheet of paper to make measurement more accurate!
Students measure pencils carefully to see how “healthy” they are after a week roaming the wilds of our classroom.
Data Analysis
After measuring, we noticed that the cheaper Dixon pencils seemed shorter as a group. I asked the children how we could compare the two brands to see for sure if one lasted longer than the other. We talked a lot about how to do this; could we compare the biggest only? Each pencil from smallest to largest? The smallest only?
I told them that scientists often have to compare groups with each other just as we are having to do, and suggested that we needed to not just compare individual pencils, but we would need to somehow compare an entire group of pencils with another entire group. How could we do that?
One student, Isaac, mentioned that maybe we could compare the average size of the pencils in each group (or the median). That way we would be comparing all the pencils of one brand (by calculating the mean or median) with all the other pencils of the other brand.
This was a central insight about elementary-level statistics, and considers a question that scientists have to think about all the time! Also, while we have been figuring medians and means for awhile, the children have never actually understood why these values are important. To me, this insight about why scientists need to think about means and medians was one of the best things to come from our experiment.
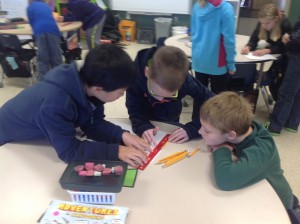
Here are two pictures of the children figuring out the median pencil size by re-arranging sticky notes with the pencil sizes on them. To do this, we had to think about how to represent the “dead” pencils, and decided that their “health” should be 0.0 cm. They also had to think about simple things like how to construct data tables, and how to incorporate new data into their evolving medians as new research groups added more sticky notes to their growing collection.
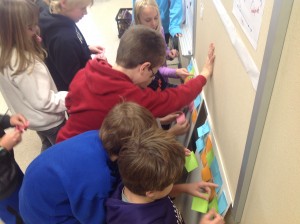
Note all the hands actively involved in rearranging the sticky notes. There were a lot of great conversations. Students in the back were beginning to notice patterns between the two data sets.

Even re-arranging the sticky notes required the children to think through an organized way to do this evolving task as new data was coming as research groups completed their measuring.
Our results showed average pencil size of 13.3 cm for the MegaBrands (1 “death”) and 10.2 cm for the Dixons (four “deaths.)
Next Steps
Next, we will graph our data. We still haven’t decided how to figure out whether the cheaper pencils are actually cheaper. As one child asked: What if the cheap pencils were only a penny, but broke very easily, and the others were $1,000 but lasted a long time. Maybe it would still be cheaper to buy the cheap pencils.
Perhaps we will have to figure out how to use our “mark and recapture” data to predict when all of pencils will “die.” We will also need to gather information about price differences between the two pencils. Then we’ll probably need to compare our “death rates” with the difference in price. This will be difficult for the kids to imagine as they haven’t had experience with graphs as “predictors” of outcomes before, but I think the fact that they have now “lived” the experience of using the pencils, and have seen the differences in lengths that resulted from those days in the wild, that when we graph the data they will see how graphs render those differences visually. Perhaps then the children may be ready to draw a line on a graph down to zero and understand how a graph might help us understand a future event.
Finally, if the kids are interested, I’d love to turn this experiment into a look at how pencils are made and at the way consumer goods (and consumer choices) are influenced by price, which is influenced by the sourcing of the pencil wood and lead material, and probably also the labor costs. Where do the leads and woods for the cheaper Dixon pencils come from? This could be a fascinating way to look at global trade, the sourcing of raw materials, and the effect of labor cost on the manufacture of consumer goods.